Using Datadog Bits Investigation to explain pod restart alerts
On-call alerts are fast. Finding the cause is not. A pod restart message tells you that a pod restarted. It does not tell you whether the node was drained, whether a downstream connection failed because of that drain, or whether the pod ran out of memory. Those three cases all arrive as the same kind of alert, and telling them apart used to mean opening logs, events, and node status by hand.
I spent time in Datadog’s Bits Investigation feature to see if that first pass can happen with the alert, instead of after someone starts digging.
What I tried to change
The useful outcome is a short cause posted with the alert: where to look, and which of the known patterns this burst matches. The goal is not to stop reading the evidence. It is to stop starting from zero every time the same shape of alert fires for a different reason.
Bits Investigation is Datadog’s agent for that. On a supported monitor it can start when the monitor enters Alert, look at metrics, logs, traces, Kubernetes events, and recent changes, and write a conclusion. If the monitor already notifies Slack, Bits is meant to reply in that alert’s thread.
What “enabled” actually means
Turning on Investigate with Bits is per monitor. It does not turn the feature on for every alert in the account.
Once it is on for a monitor, two different things can happen:
- Automatic. Bits starts only when that monitor newly becomes Alert. A warning, a no-data state, a re-notification of an alert that is already firing, or a test message does not start one. Each monitor also gets one automatic investigation per 24 hours by default. If the same monitor recovers and alerts again later that day, even for a different reason, the automatic run does not start again.
- Manual. In the Slack thread, the Investigate with Bits button, or the reply
@Datadog Investigate this alert, still starts a run. That path is not limited to once a day.
The Slack result is one alert message, then a follow-up in the thread. Bits does not post a second top-level message. The follow-up arrives after the investigation finishes, not at the same instant as the page.
The pod restart case
Example of an alert pattern I explored with Bits.
We get bursts of pod restart alerts. They look alike in Slack. The last time I traced one, the node group had stopped responding. Kubernetes drained the workers off those nodes and started them elsewhere. The new pods were not stable in the first minute, so they restarted again and the monitor fired.
That same drain showed up as a second alert shape. Envoy pods could not connect to Temporal frontend pods while the nodes were being drained, and those connection failures also surfaced as pod restarts. A real out-of-memory kill produces restart alerts too.
So one symptom, three causes:
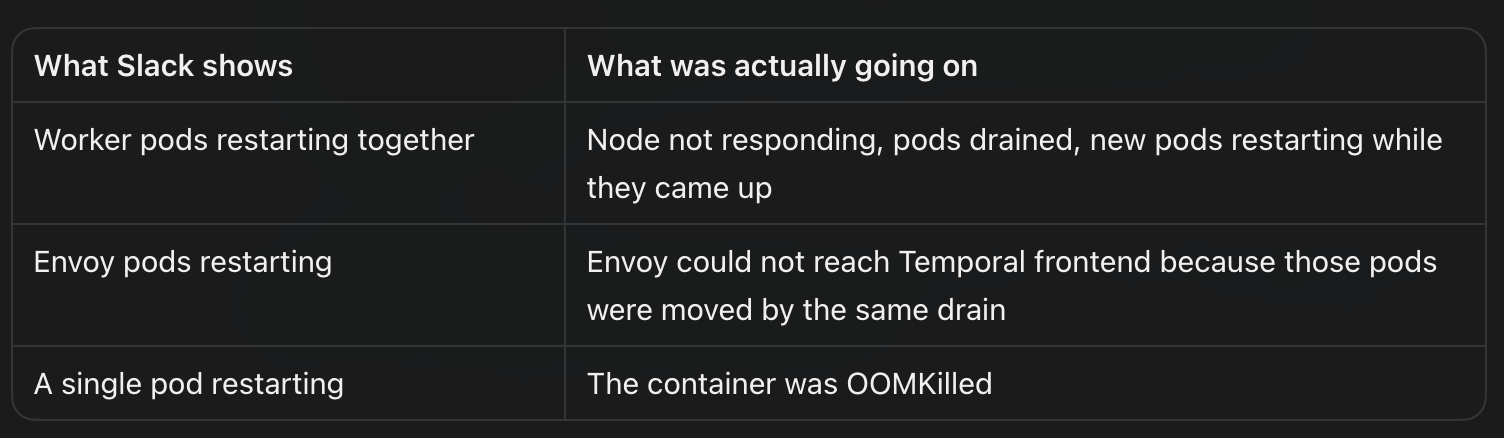
The slow part was not seeing that a pod had restarted. It was deciding which of those histories this burst belonged to.
Giving Bits the past reasons
Bits can query Kubernetes events, node status, and logs. It does not know our past incidents unless we write them down. One way is I can put the checklist on the restart monitor, in the message body, because Bits reads that message when it investigates that monitor. (You can also make use of confluence..etc)
A burst of pod restarts is often one incident, not one bad pod.
Check these causes in order and keep the one the events support.

1. Node drain.
   If the node was NotReady or not responding, pods on it were drained
   and started on another node. Restarts in the first minute after that
   move are expected. They matter if the new pod keeps restarting after
   it is Ready.

2. Dependent restart from that drain.
   If Envoy pods restart at the same time, check whether they lost
   their connection to Temporal frontend pods that were drained with
   the node. The Envoy restart is a symptom of the node event.

3. Memory.
   If the pod was OOMKilled and no node drain happened at that time,
   treat it as its own incident.

Treat restarts that share the same node and the same minute as one cause.
That list does not tell Bits the answer. It tells Bits which evidence to look for, and how we have distinguished these cases before. A drain plus Envoy connection errors should land on cause 2. An OOM Killed container with a healthy node should land on cause 3.
Other places hold context that is not specific to this monitor:
- Feedback after a run is how a new cause gets remembered. Slack does not show a right/wrong button. The correction is made on the investigation page in Datadog. If Bits blames memory and the events show a drain, the useful correction is specific: “The node group was not responding. Workers were drained. Envoy restarted because it could not reach Temporal frontend pods that moved with the node. This was not an OOM.” Datadog stores that as a memory and can apply it to a later alert of the same shape.
What I would trust it with
I would turn this on first for the pod restart monitor, with the three causes in the message. One automatic investigation for the whole burst is the right shape: the replies in Slack are many pods, and the cause is usually one node event.
I would not treat the first conclusion as final. Bits can come back inconclusive when the node events are missing, and a burst that is really a new cause will not match the list. The check is still the events. The gain is that the first pass follows the same order a person eventually learned to use.
What I learned
Bit AI can be useful if trained it for the type of alerts we receive.\
Comments
Join the discussionNo comments yet. Be the first to comment.